Deploy Next.js in Kubernetes with Watt
In this guide, we are configuring and setting up a Next.js application in very common enterprise environment: Kubernetes (K8s).
We will use Watt, the application server for Node.js, to set up:
- metrics with Prometheus
- multithreading server-side rendering
- distributed caching with Redis/Valkey
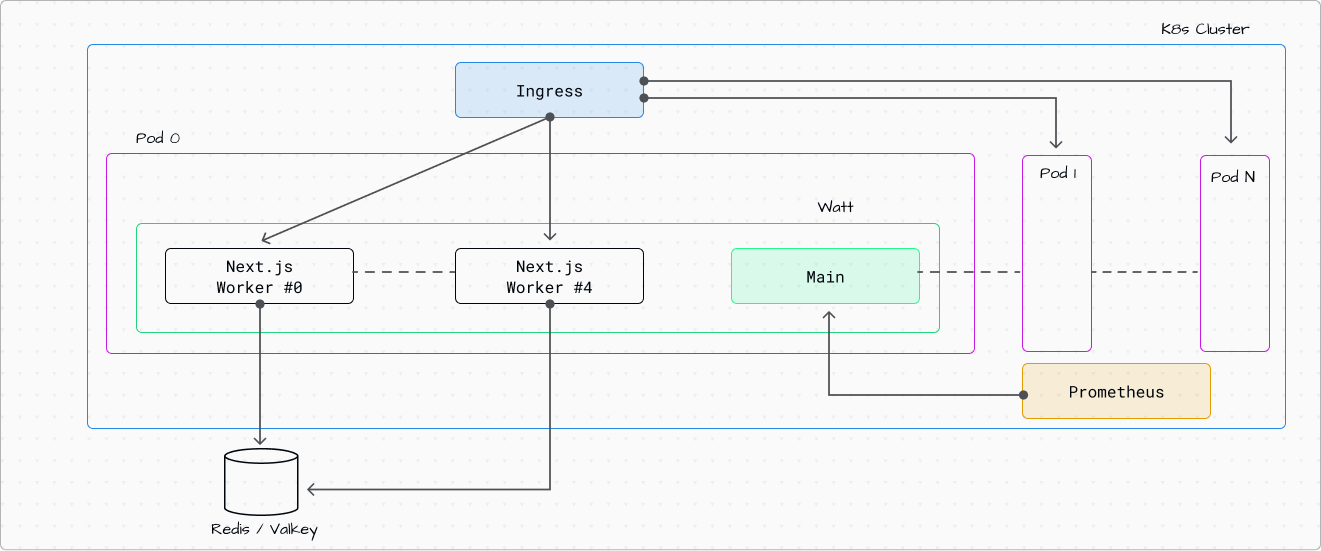
Here is the highlight of the architecture:
Complete Working Example: The full code for this guide is available at https://github.com/platformatic/k8s-watt-next-example. You can clone it and follow along, or use it as a reference while building your own application.
Create a new Next.js application (or use your own)
To follow this guide, you can either create a new Next.js application or use an existing one. If you want to see a complete working example, check out our k8s-watt-next-example repository.
Create a New Next.js App
Create a new Next.js application using the official CLI:
npx create-next-app@15 my-next-app
cd my-next-app
When prompted, select your preferences. We recommend:
- TypeScript: Yes
- ESLint: Yes
- Tailwind CSS: Yes (optional)
- App Router: Yes (recommended)
Add Incremental Static Regeneration or 'use cache'
To demonstrate the benefits of distributed caching with Watt and Valkey, you should add either Incremental Static Regeneration (ISR) or the new use cache directive to your application.
Let's modify the home page to show cached data that demonstrates how caching works across multiple pods:
// src/app/page.tsx
import { hostname } from "os";

export const revalidate = 10; // Revalidate every 10 seconds

export default async function Home() {
  const name = hostname();
  const version = Date.now();

  return (
    <div>
      <h1>Welcome to Next.js + Platformatic!</h1>

      <h3>
        Last server date is <strong>{version}</strong>, served by{" "}
        <strong>{name}</strong>
      </h3>
    </div>
  );
}
In this example:
export const revalidate = 10enables time-based revalidation every 10 secondshostname()shows which pod is serving the request (useful when you have multiple replicas)Date.now()generates a timestamp that will be cached and shared across all pods
What happens with caching:
- When the first request comes in, Next.js renders the page and stores the result in the cache (Valkey)
- For the next 10 seconds, all requests to any pod will receive the same cached version with the same timestamp
- After 10 seconds, the next request triggers a revalidation, updates the cache, and all pods get the new version
- The hostname shows you which pod served the request, but the timestamp stays the same across all pods (proving the cache is shared)
Other Caching Options
Option 2: On-demand Revalidation
Use revalidateTag or revalidatePath to manually trigger cache revalidation:
// src/app/actions.ts
'use server'
import { revalidatePath } from 'next/cache';

export async function updateData() {
  // Update your data...
  revalidatePath('/');
}
Option 3: React Cache (Next.js 15+)
With Next.js 15+, you can use the new unstable_cache for more granular caching:
// src/app/page.tsx
import { unstable_cache } from 'next/cache';

const getCachedData = unstable_cache(
  async () => {
    return fetch('https://api.example.com/data').then(res => res.json());
  },
  ['data-key'],
  { revalidate: 10 }
);

export default async function Page() {
  const data = await getCachedData();
  // Your component logic
}
Why is caching important?
When you deploy multiple replicas of your Next.js application in Kubernetes, each pod maintains its own cache by default. With Watt's Valkey integration, all pods share a single distributed cache, which means:
- Faster response times across all pods
- Reduced load on your backend APIs and databases
- Consistent data across all replicas
- Better resource utilization
Add watt.json
In order to run your existing Next.js application with Watt, you can use the import capability of wattpm-utils.
From the root of your application, run:
npx wattpm-utils import
The command will create a watt.json for you and also install @platformatic/next as part of your dependencies.
By default, Watt will run on random port. If you want to choose a specific port, add an entry in the watt.json file
with a runtime block. In the same block, we also need to add the configuration to support multithreading. Add it like
following:
{
  ...
  "runtime": {
    "server": {
      "host": "0.0.0.0",
      "port": "{PORT}"
    },
    "workers": {
      "static": "{PLT_NEXT_WORKERS}"
    }
  }
}
The {MYENV} syntax tells Watt to take that value from the process environment; .env loading is also fully supported.
You will also need to configure the Valkey connection string. Edit it and add:
{
  ...
  "cache": {
    "adapter": "valkey"
    "url": "{PLT_VALKEY_HOST}"
  }
}
At the end, your watt.json should match:
{
  "$schema": "https://schemas.platformatic.dev/@platformatic/next/3.8.0.json",
  "runtime": {
    "server": {
      "host": "0.0.0.0",
      "port": "{PORT}"
    },
    "workers": {
      "static": "{PLT_NEXT_WORKERS}"
    }
  },
  "cache": {
    "adapter": "valkey"
    "url": "{PLT_VALKEY_HOST}"
  }
}
If you prefer, you can also use YAML format and use a watt.yml.
Test it locally
To test this setup locally, you can spawn a Valkey image using Docker:
docker run -d -p 6379:6379 valkey/valkey:latest
Then write a .env file in your project, like so:
PORT=3000
PLT_VALKEY_HOST=localhost
PLT_NEXT_WORKERS=1
Then, run:
npx wattpm build
npx wattpm start
If you want to start a second copy of your application on a different port, you can with:
PORT=3001 npx wattpm start
(You can also run wattpm dev for development mode)
Create and build the Docker image
In order to run our application inside Kubernetes, we need to build our Docker image first. The most basic Dockerfile needed is:
FROM node:24-slim

WORKDIR /app
COPY ./ ./
RUN npm install && npm run build

ENV PLT_SERVER_HOSTNAME=0.0.0.0
EXPOSE 3042
CMD ["npm", "run", "start"]
Configure environment variables like PORT, PLT_NEXT_WORKERS, and PLT_VALKEY_HOST via your K8s deployment yaml.
Using Next.js Standalone Mode
Next.js standalone mode creates a minimal, self-contained build that includes only the necessary files to run your application. This results in smaller Docker images and faster deployments.
Enable Standalone Mode
Add output: "standalone" to your next.config.js or next.config.mjs.
  // next.config.mjs
  const nextConfig = {
    output: "standalone"
  }
export default nextConfig
Here's an example of a minimal package.json for a Next.js standalone app:
{
  "name": "my-next-app",
  "private": true,
  "scripts": {
    "dev": "next dev",
    "build": "next build"
  },
  "dependencies": {
    "next": "^15.0.0",
    "react": "^19.0.0",
    "react-dom": "^19.0.0"
  }
}
This is a standard Next.js package.json - no Watt dependencies needed. The wattpm and @platformatic/next packages are installed only in the Docker production image.
And a minimal watt.json:
{
  "$schema": "https://schemas.platformatic.dev/@platformatic/next/3.30.0.json",
  "next": {
    "standalone": true
  },
  "runtime": {
    "server": {
      "hostname": "{PLT_SERVER_HOSTNAME}",
      "port": "{PORT}"
    }
  }
}
The only required change is to insert standalone: true in the next section.
Why use Watt with standalone instead of raw Next.js standalone?
While Next.js standalone mode produces a minimal server.js that can run independently, using Watt provides additional enterprise features:
- Prometheus metrics integration
- Multi-threaded SSR with worker management
- Distributed caching with Valkey/Redis
- Health check endpoints
- Unified logging and observability
The trade-off is a slightly larger Docker image since Watt and its dependencies (@platformatic/* packages) must be included alongside the standalone build.
Dockerfile for Standalone Mode
Next.js standalone mode uses @vercel/nft to trace dependencies and only includes packages that are actually imported by your application code.
The .next/static folder and public folder must be copied manually if needed.
# Stage 1: Build
FROM node:24-slim AS builder

WORKDIR /app
COPY ./ ./
RUN npm install && npm run build

# Stage 2: Production
FROM node:24-slim

WORKDIR /app

# Copy the necessary files from the builder stage
COPY --from=builder /app/.next/standalone .
COPY --from=builder /app/watt.json ./watt.json
COPY --from=builder /app/.next/static .next/static
# Remove or comment out the following if you don't have a public folder
COPY --from=builder /app/public ./public

# Install Watt and Platformatic Next with a specific version
ARG PLT_VERSION=3.33.0
RUN npm install -g wattpm@${PLT_VERSION} @platformatic/next@${PLT_VERSION}

ENV PLT_SERVER_HOSTNAME=0.0.0.0
ENV PORT=3042
EXPOSE 3042
CMD ["wattpm", "start"]
Important: You must specify the Platformatic version (PLT_VERSION) in the Dockerfile. Both wattpm and @platformatic/next must use the same version. Update the default value in the ARG line, or override it at build time:
docker build --build-arg PLT_VERSION=3.30.0 -t my-next-app .
Alternative: keep Watt in package.json
If you prefer to manage the runtime version through normal package-manager tooling, add wattpm and @platformatic/next to your app dependencies and start the local binary from the final image.
Example production stage:
FROM node:24-slim

WORKDIR /app
COPY ./ ./
RUN npm install && npm run build

ENV PLT_SERVER_HOSTNAME=0.0.0.0
ENV PORT=3042
EXPOSE 3042
CMD ["./node_modules/.bin/wattpm", "start"]
This keeps the Platformatic version in package.json, where tools such as Dependabot or Renovate can manage it.
Alternative: pack a self-contained bundle
Use the Next-specific application command exposed by Watt to create a deployable bundle that already includes the runtime pieces Watt needs.
From the project root:
npx wattpm build
npx wattpm <app-id>:pack --output .platformatic/next-bundle
Replace <app-id> with your application id. For a single imported app, it usually comes from package.json.
The packed bundle contains:
- the Next standalone output
.next/staticpublic/when present- a bundle-local
watt.json - a bundle-local
./node_modules/.bin/wattpm
That means the production image only needs to copy the bundle and start it.
Example Dockerfile:
# Stage 1: Build and pack
FROM node:24-slim AS builder

WORKDIR /app
COPY ./ ./
RUN npm install
RUN npx wattpm build
RUN npx wattpm my-next-app:pack --output .platformatic/next-bundle

# Stage 2: Production
FROM node:24-slim

WORKDIR /app
COPY --from=builder /app/.platformatic/next-bundle/ ./

ENV PLT_SERVER_HOSTNAME=0.0.0.0
ENV PORT=3042
EXPOSE 3042
CMD ["./node_modules/.bin/wattpm", "start"]
This flow has two advantages over installing Watt in the production image:
- the final image does not run
npm install - the Dockerfile does not need to hardcode a Platformatic version
Verifying Standalone Mode
After building, verify that standalone mode is working:
# Check that .next/standalone exists
ls -la .next/standalone/

# The directory should contain server.js and minimal dependencies
If you are using the packed-bundle flow, you can also verify the packed output directly:
ls -la .platformatic/next-bundle/
ls -la .platformatic/next-bundle/node_modules/.bin/wattpm
When Watt starts with a standalone build, it automatically detects and uses the standalone server internally while providing all the Watt runtime features.
Building the image
There are a few different ways to build the image, depending on where your K8s cluster is running. Assuming you are following this guide with a locally running k8s, these are the most common options.
Option A: Build using Docker Desktop or Local Docker
If you're using Docker Desktop or a local Docker daemon:
docker build -t next-app:latest .
Option B: Build using Minikube
If you're using Minikube, you need to use Minikube's Docker daemon:
eval $(minikube docker-env)
docker build -t next-app:latest .
Option C: Build using Kind
If you're using Kind, load the image into the cluster:
docker build -t next-app:latest .
kind load docker-image next-app:latest
Verify the Image was Built
Check that the image exists:
docker images | grep next-app
You should see next-app:latest in the list.
Deploy Prometheus and Valkey in K8s
Start a K8S Cluster
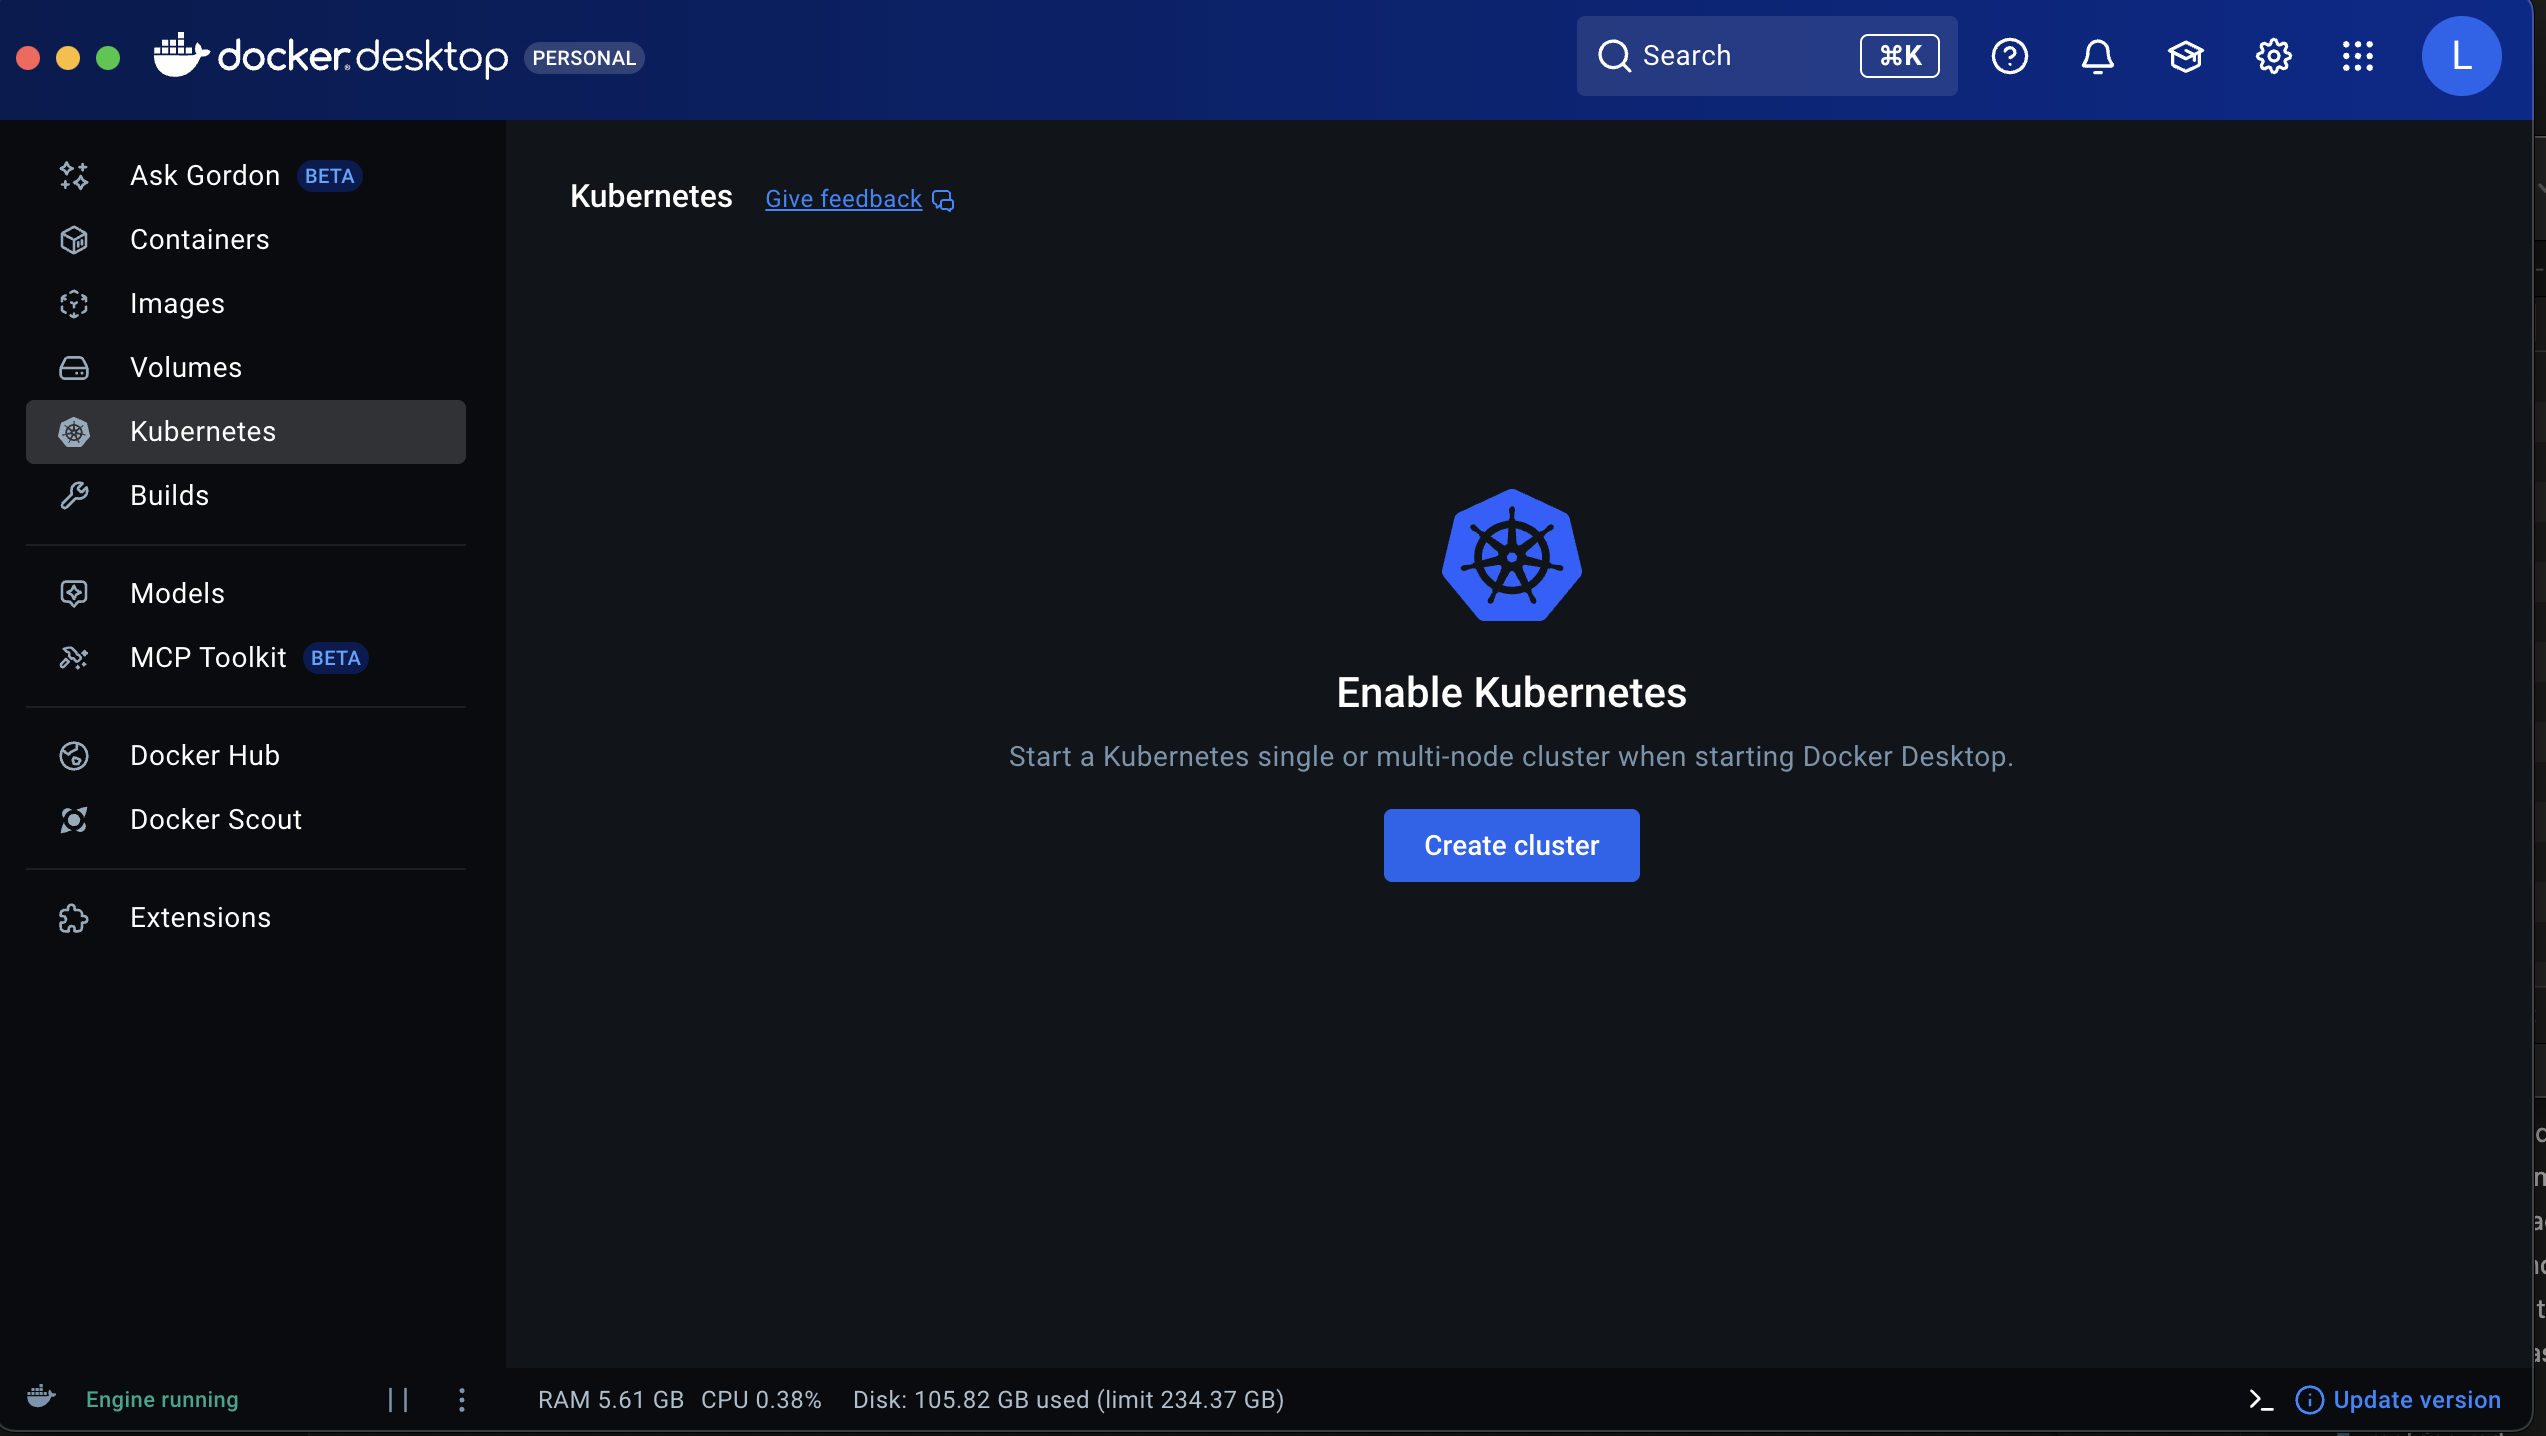
In this example we will use Docker Desktop's built-in kubernetes cluster.
Enable the cluster from Docker Desktop main page
Helm
Install helm for your system
Deploy Valkey in the cluster
Create a file valkey-overrides.yaml to configure Valkey deploy configuration
service:
  type: "NodePort"
auth:
  enabled: false
Then deploy valkey with the following command
helm upgrade --install valkey oci://registry-1.docker.io/cloudpirates/valkey \
  --values=valkey-overrides.yaml \
  --version=0.3.2
Deploy Prometheus in the cluster
First, add the Prometheus community Helm repository:
helm repo add prometheus-community https://prometheus-community.github.io/helm-charts
helm repo update
Create a file prometheus-overrides.yaml to configure Prometheus deploy configuration
prometheus:
  service:
    type: NodePort
    nodePort: 30090
helm upgrade --install prometheus prometheus-community/kube-prometheus-stack \
  --values=helm/prometheus-overrides.yaml \
  --namespace=monitoring \
  --create-namespace
Deploy the application
You need 3 files to have a minimal installation: deployment.yaml, service.yaml and podMonitor.yaml.
deployment.yaml
This file describes the deployment of your application. Let's break down the key configuration sections:
Resource Management:
resources.requests: The minimum CPU (1000m = 1 core) and memory (256Mi) guaranteed for each podresources.limits: The maximum CPU (1000m) and memory (1024Mi) a pod can consume before being throttled or restarted- Setting appropriate limits prevents resource starvation and ensures fair resource allocation across pods
- Important: If you increase the number of workers via
PLT_NEXT_WORKERSenvironment variable, you should proportionally increase the CPU limit. For example, settingPLT_NEXT_WORKERS=4would require approximately 4000m (4 cores) CPU limit to ensure each worker has adequate resources
Health Checks:
livenessProbe: Determines if the container is still running. If it fails, Kubernetes will restart the podinitialDelaySeconds: 30: Wait 30 seconds after startup before checking (gives time for app initialization)periodSeconds: 10: Check every 10 seconds
readinessProbe: Determines if the container is ready to accept traffic. If it fails, the pod is removed from service endpointsinitialDelaySeconds: 10: Wait 10 seconds before first checkperiodSeconds: 5: Check every 5 seconds
Ports:
- Port
3000: The main HTTP port for your Next.js application - Port
9090: The metrics endpoint for Prometheus to scrape
Labels:
The platformatic.dev/monitor: prometheus label is crucial - it allows the PodMonitor to discover and scrape metrics from your application.
apiVersion: apps/v1
kind: Deployment
metadata:
  name: next-app
  labels:
    app: next-app
spec:
  replicas: 1
  selector:
    matchLabels:
      app: next-app
  template:
    metadata:
      labels:
        app: next-app
        platformatic.dev/monitor: prometheus
    spec:
      containers:
      - name: next-app
        image: next-app:latest
        imagePullPolicy: IfNotPresent
        ports:
        - containerPort: 3000
          name: http
        - containerPort: 9090
          name: metrics
        env:
        - name: NODE_ENV
          value: "production"
        - name: PORT
          value: "3000"
        - name: HOSTNAME
          value: "0.0.0.0"
        resources:
          requests:
            memory: "256Mi"
            cpu: "1000m"
          limits:
            memory: "1024Mi"
            cpu: "1000m"
        livenessProbe:
          httpGet:
            path: /
            port: 3000
          initialDelaySeconds: 30
          periodSeconds: 10
        readinessProbe:
          httpGet:
            path: /
            port: 3000
          initialDelaySeconds: 10
          periodSeconds: 5
service.yaml
This file creates a Kubernetes Service that exposes your application to the outside world:
Service Type:
type: NodePort: Exposes the service on a static port on each node in the cluster. This makes your app accessible from outside the cluster via<NodeIP>:<NodePort>
Port Configuration:
port: 3000: The port that the service listens on within the clustertargetPort: 3000: The port on the pod that traffic is forwarded to (matches the container port in deployment.yaml)nodePort: 32100: The external port exposed on each node (range: 30000-32767)protocol: TCP: The network protocol used
Selector:
The app: next-app selector ensures the service routes traffic only to pods with the matching label.
With this configuration, your Next.js application will be accessible at http://localhost:32100 when using a local Kubernetes cluster.
apiVersion: v1
kind: Service
metadata:
  name: next-app-service
  labels:
    app: next-app
spec:
  type: NodePort
  selector:
    app: next-app
  ports:
  - port: 3000
    targetPort: 3000
    nodePort: 32100
    protocol: TCP
    name: http
podMonitor.yaml
This file configures Prometheus to automatically discover and scrape metrics from your application pods. PodMonitor is a custom resource provided by the Prometheus Operator:
Selector:
The platformatic.dev/monitor: prometheus label selector tells Prometheus which pods to monitor. This must match the label in your deployment.yaml template.
Metrics Endpoint Configuration:
port: metrics: Scrape from the port named "metrics" (port 9090 in the deployment)path: /metrics: The HTTP path where metrics are exposedinterval: 15s: How often Prometheus scrapes metrics (every 15 seconds)honorLabels: false: Prometheus labels take precedence over scraped labels
Relabeling:
The relabelings section customizes how metrics are labeled in Prometheus:
- Extracts Kubernetes pod metadata (app name, instance)
- Makes metrics easier to query and correlate in Prometheus
Namespace and Labels:
namespace: default: The PodMonitor runs in the default namespacerelease: prometheus: This label is required for the Prometheus Operator to discover this PodMonitor
With this configuration, Prometheus will automatically start collecting Node.js runtime metrics, HTTP request metrics, and other performance data from your Watt-powered Next.js application.
apiVersion: monitoring.coreos.com/v1
kind: PodMonitor
metadata:
  name: next-app-pod-monitor
  namespace: default
  labels:
    release: prometheus
spec:
  selector:
    matchLabels:
      # app: next-app
      platformatic.dev/monitor: prometheus
  podMetricsEndpoints:
  - honorLabels: false
    interval: 15s
    port: metrics
    path: /metrics
    relabelings:
    - action: replace
      sourceLabels:
      - __meta_kubernetes_pod_label_app_kubernetes_io_name
      targetLabel: name
    - action: replace
      sourceLabels:
      - __meta_kubernetes_pod_label_app_kubernetes_io_instance
      targetLabel: instance
Then you can apply all these files with the command
kubectl apply -f service.yaml -f deployment.yaml -f podMonitor.yaml
Verify metrics
Open http://localhost:32100 to see your app running
Then open http://localhost:30090 to open Prometheus Dashboard
Start to type nodejs and if you see an autocomplete like the following image
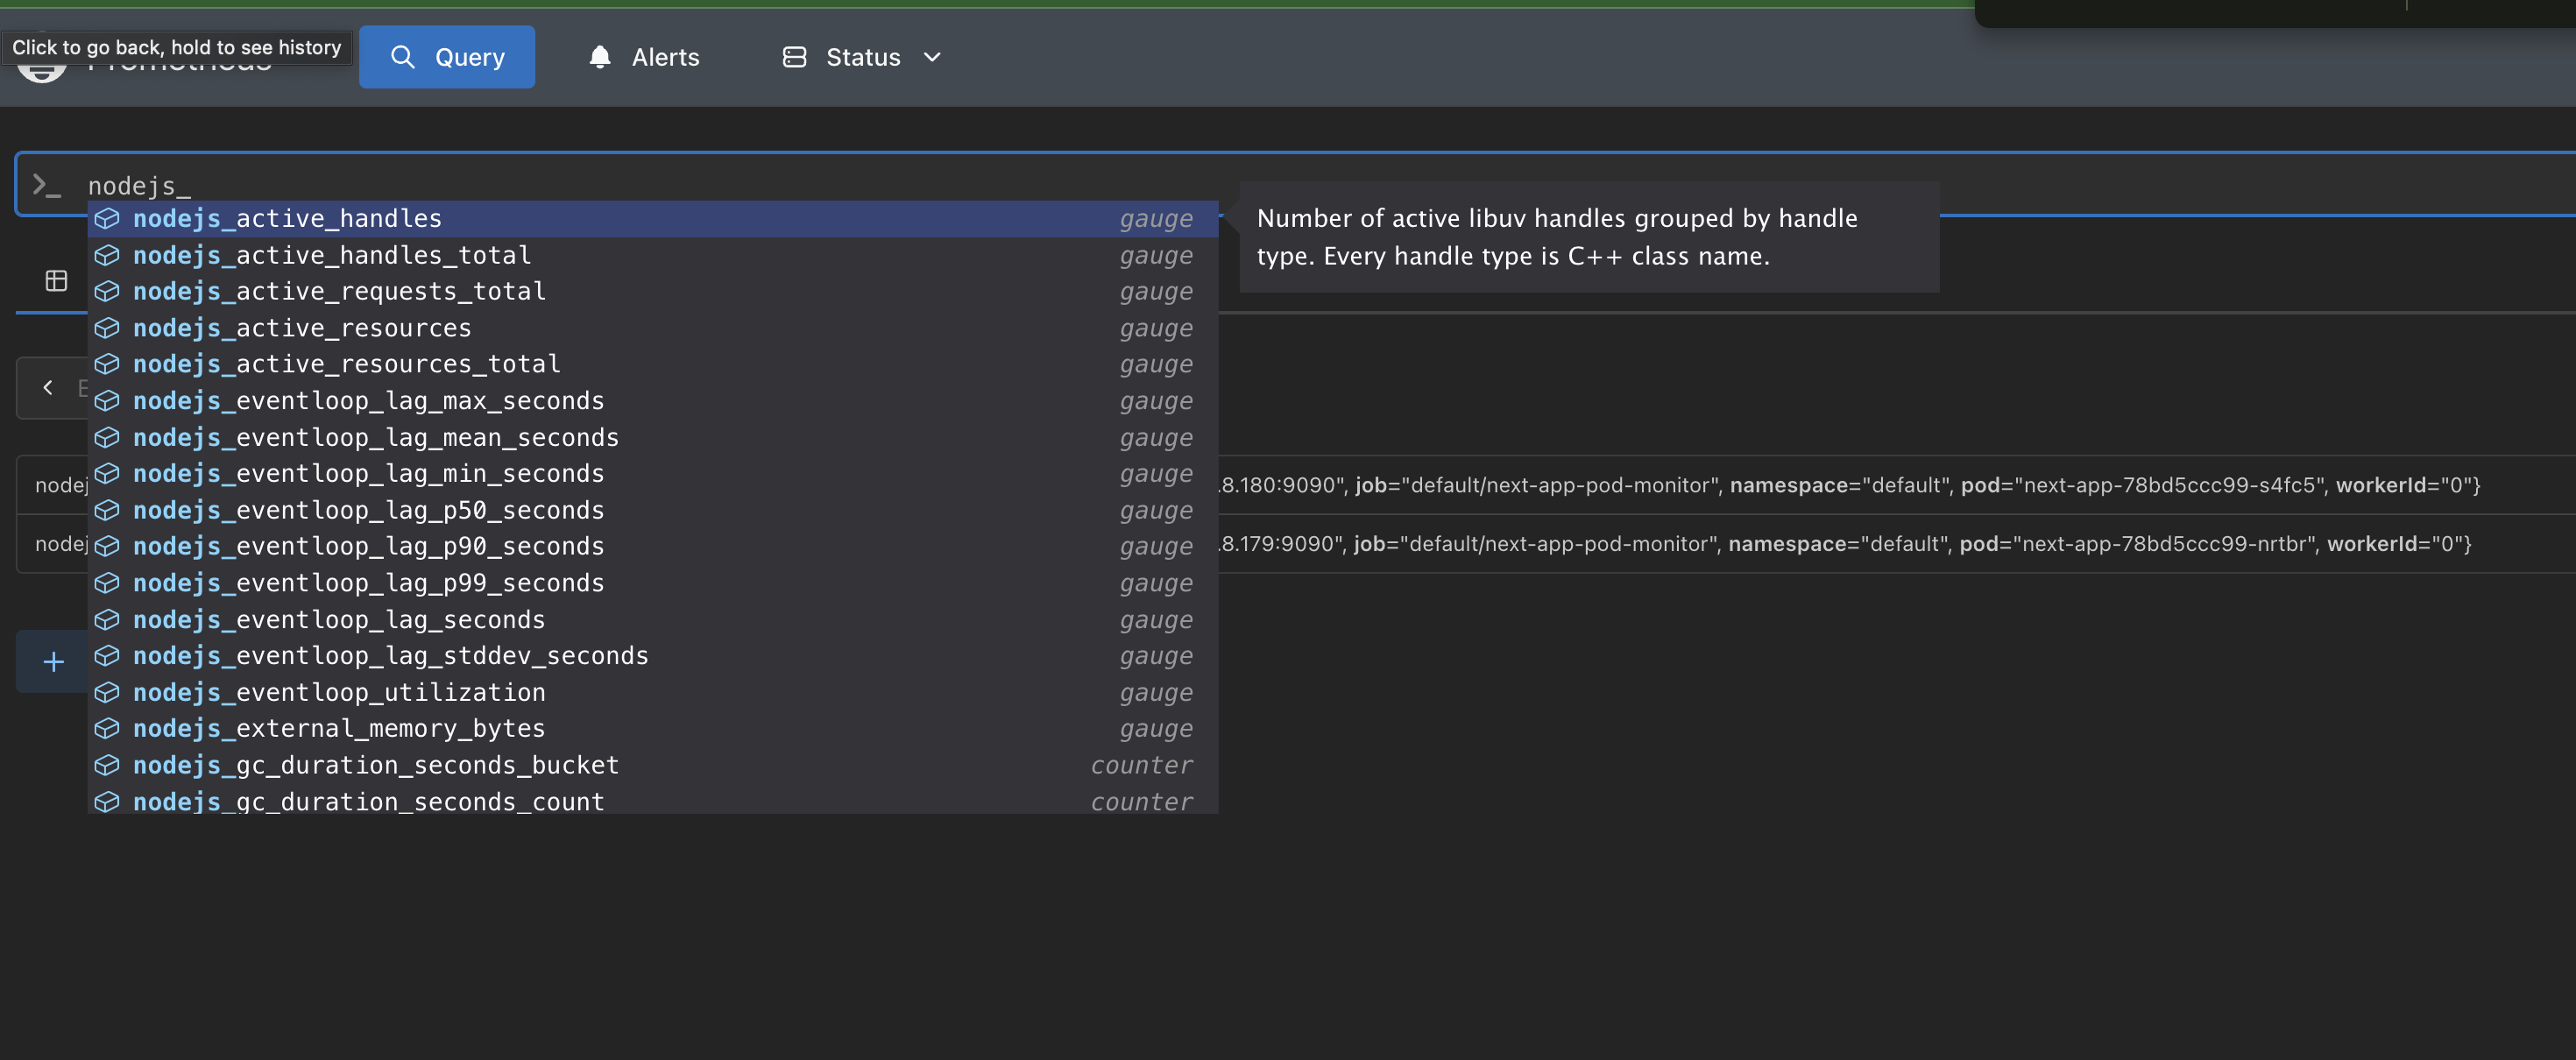
you're done!
Prometheus is now monitoring your app and collecting metrics!
Conclusion
Congratulations! You've successfully deployed a production-ready Next.js application in Kubernetes with enterprise-grade features:
What You've Accomplished:
- Multithreaded Server-Side Rendering: Configured Watt workers to handle multiple concurrent SSR requests efficiently
- Distributed Caching: Integrated Valkey (Redis-compatible) for shared cache across multiple pod replicas
- Observability: Set up Prometheus monitoring with automatic metrics collection for Node.js runtime and HTTP requests
- Production Deployment: Created proper Kubernetes manifests with health checks, resource limits, and service discovery
- Scalability: Built a foundation that can scale horizontally by increasing pod replicas
Key Takeaways:
- The
watt.jsonconfiguration enables seamless integration of Next.js with enterprise infrastructure - Resource limits should be adjusted based on the number of workers (
PLT_NEXT_WORKERS) - The
platformatic.dev/monitor: prometheuslabel connects your application to the monitoring stack - Health probes ensure Kubernetes can detect and recover from application failures automatically
Next Steps:
- Scale your deployment by increasing
spec.replicasin deployment.yaml - Add an Ingress resource to handle external traffic routing and TLS termination
- Configure horizontal pod autoscaling (HPA) based on CPU/memory or custom metrics
- Set up persistent storage if your application needs stateful data
- Implement CI/CD pipelines to automate the build and deployment process
Your Next.js application is now running in a production-grade Kubernetes environment with full observability!