Telemetry with Jaeger
Introduction
Platformatic supports Open Telemetry integration. This allows you to send telemetry data to one of the OTLP compatible servers (see here) or to a Zipkin server. Let's show this with Jaeger.
Jaeger setup
The quickest way is to use docker:
docker run -d --name jaeger \
  -e COLLECTOR_OTLP_ENABLED=true \
  -p 16686:16686 \
  -p 4317:4317 \
  -p 4318:4318 \
  jaegertracing/all-in-one:latest
Check that the server is running by opening http://localhost:16686/ in your browser.
Platformatic setup
Will test this with a Platformatic Composer that proxy requests to a Platformatic Service, which in turn invokes a Platformatic DB Service. In this way we show that the telemetry is propagated from the Composer throughout the services and the collected correctly. Let's setup all these components:
Platformatic DB Service
Create a DB service using npx wattpm create:
mkdir test-db
cd test-db
npx wattpm create
To make it simple, use sqlite and create/apply the default migrations. This DB Service is exposed on port 5042:
Hello User, welcome to Watt 2.64.0!
? Where would you like to create your project? .
? Which kind of service do you want to create? @platformatic/db
? What is the name of the service? main
? What is the connection string? sqlite://./db.sqlite
? Do you want to create default migrations? yes
? Do you want to create another service? no
? Do you want to use TypeScript? no
? What port do you want to use? 5042
[12:11:45.131] INFO (504): /work/package.json written!
[12:11:45.135] INFO (504): /work/watt.json written!
[12:11:45.137] INFO (504): /work/.env written!
[12:11:45.138] INFO (504): /work/.env.sample written!
[12:11:45.138] INFO (504): /work/.gitignore written!
[12:11:45.139] INFO (504): /work/README.md written!
[12:11:45.140] INFO (504): /work/web/main/package.json written!
[12:11:45.141] INFO (504): /work/web/main/platformatic.json written!
[12:11:45.142] INFO (504): /work/web/main/plugins/example.js written!
[12:11:45.144] INFO (504): /work/web/main/routes/root.js written!
[12:11:45.144] INFO (504): /work/web/main/test/helper.js written!
[12:11:45.145] INFO (504): /work/web/main/test/plugins/example.test.js written!
[12:11:45.146] INFO (504): /work/web/main/test/routes/root.test.js written!
[12:11:45.146] INFO (504): /work/web/main/.gitignore written!
[12:11:45.147] INFO (504): /work/web/main/migrations/001.do.sql written!
[12:11:45.148] INFO (504): /work/web/main/migrations/001.undo.sql written!
[12:11:45.148] INFO (504): /work/web/main/README.md written!
[12:11:45.149] INFO (504): /work/web/main/test/routes/movies.test.js written!
[12:11:45.149] INFO (504): /work/web/main/global.d.ts written!
? Do you want to init the git repository? no
[12:11:46.798] INFO (504): Installing dependencies for the application using npm ...
[12:11:51.343] INFO (504): Installing dependencies for the service db using npm ...
[12:11:52.165] INFO (504): Project created successfully, executing post-install actions...
[12:11:52.166] INFO (504): You are all set! Run `npm start` to start your project.
Open the web/main/platformatic.json file and add the telemetry configuration:
  "telemetry": {
    "serviceName": "test-db",
    "exporter": {
      "type": "otlp",
      "options": {
        "url": "http://localhost:4318/v1/traces"
      }
    }
  }
Finally, start the application:
npm run start
Platformatic Service
Create at the same level of test-db another folder for Service and cd into it:
mkdir test-service
cd test-service
npx wattpm create
Then create a service on the 5043 port in the folder using npx wattpm create:
Hello User, welcome to Watt 2.64.0!
? Where would you like to create your project? .
? Which kind of service do you want to create? @platformatic/service
? What is the name of the service? main
? Do you want to create another service? no
? Do you want to use TypeScript? no
? What port do you want to use? 5043
[12:14:16.552] INFO (1819): /work/test-service/package.json written!
[12:14:16.557] INFO (1819): /work/test-service/watt.json written!
[12:14:16.558] INFO (1819): /work/test-service/.env written!
[12:14:16.559] INFO (1819): /work/test-service/.env.sample written!
[12:14:16.560] INFO (1819): /work/test-service/.gitignore written!
[12:14:16.560] INFO (1819): /work/test-service/README.md written!
[12:14:16.562] INFO (1819): /work/test-service/web/main/package.json written!
[12:14:16.563] INFO (1819): /work/test-service/web/main/platformatic.json written!
[12:14:16.564] INFO (1819): /work/test-service/web/main/plugins/example.js written!
[12:14:16.566] INFO (1819): /work/test-service/web/main/routes/root.js written!
[12:14:16.566] INFO (1819): /work/test-service/web/main/test/helper.js written!
[12:14:16.567] INFO (1819): /work/test-service/web/main/test/plugins/example.test.js written!
[12:14:16.567] INFO (1819): /work/test-service/web/main/test/routes/root.test.js written!
[12:14:16.567] INFO (1819): /work/test-service/web/main/.gitignore written!
[12:14:16.568] INFO (1819): /work/test-service/web/main/global.d.ts written!
[12:14:16.568] INFO (1819): /work/test-service/web/main/README.md written!
? Do you want to init the git repository? no
[12:14:17.793] INFO (1819): Installing dependencies for the application using npm ...
[12:14:45.663] INFO (1819): Installing dependencies for the service service using npm ...
[12:14:46.568] INFO (1819): Project created successfully, executing post-install actions...
[12:14:46.568] INFO (1819): You are all set! Run `npm start` to start your project.
Open the web/main/platformatic.json file and add the following telemetry configuration (it's exactly the same as DB, but with a different serviceName)
  "telemetry": {
    "serviceName": "test-service",
    "exporter": {
      "type": "otlp",
      "options": {
        "url": "http://localhost:4318/v1/traces"
      }
    }
  }
We want this service to invoke the DB service, so we need to add a client for test-db to it:
npx platformatic client http://127.0.0.1:5042 js --name movies
Check platformatic.service.json to see that the client has been added (PLT_MOVIES_URL is defined in .env):
    "clients": [
    {
      "schema": "movies/movies.openapi.json",
      "name": "movies",
      "type": "openapi",
      "url": "{PLT_MOVIES_URL}"
    }
  ]
Now open routes/root.js and add the following:
  fastify.get('/movies-length', async (request, reply) => {
    const movies = await request.movies.getMovies()
    return { length: movies.length }
  })
This code calls movies to get all the movies and returns the length of the array.
Finally, start the service:
npm run start
Platformatic Composer
Create at the same level of test-db and test-service another folder for Composer and cd into it:
mkdir test-composer
cd test-composer
npx wattpm create
Hello User, welcome to Watt 2.64.0!
? Where would you like to create your project? .
? Which kind of service do you want to create? @platformatic/composer
? What is the name of the service? main
? Do you want to create another service? no
? Do you want to use TypeScript? no
? What port do you want to use? 5044
[12:19:25.784] INFO (3205): /work/test-composer/package.json written!
[12:19:25.790] INFO (3205): /work/test-composer/watt.json written!
[12:19:25.791] INFO (3205): /work/test-composer/.env written!
[12:19:25.792] INFO (3205): /work/test-composer/.env.sample written!
[12:19:25.793] INFO (3205): /work/test-composer/.gitignore written!
[12:19:25.793] INFO (3205): /work/test-composer/README.md written!
[12:19:25.794] INFO (3205): /work/test-composer/web/main/package.json written!
[12:19:25.795] INFO (3205): /work/test-composer/web/main/platformatic.json written!
[12:19:25.796] INFO (3205): /work/test-composer/web/main/.gitignore written!
[12:19:25.797] INFO (3205): /work/test-composer/web/main/global.d.ts written!
[12:19:25.798] INFO (3205): /work/test-composer/web/main/README.md written!
? Do you want to init the git repository? no
[12:19:26.820] INFO (3205): Installing dependencies for the application using npm ...
[12:19:57.209] INFO (3205): Installing dependencies for the service main using npm ...
[12:19:58.573] INFO (3205): Project created successfully, executing post-install actions...
[12:19:58.573] INFO (3205): You are all set! Run `npm start` to start your project.
Open web/main/platformatic.json and change it to the following:
{
  "$schema": "https://schemas.platformatic.dev/@platformatic/composer/2.64.0.json",
  "composer": {
    "services": [
      {
        "id": "example",
        "origin": "http://127.0.0.1:5043",
        "openapi": {
          "url": "/documentation/json"
        }
      }
    ],
    "refreshTimeout": 3000
  },
  "telemetry": {
    "serviceName": "test-composer",
    "exporter": {
      "type": "otlp",
      "options": {
        "url": "http://localhost:4318/v1/traces"
      }
    }
  },
  "watch": true
}
Note that we just added test-service as origin of the proxied service and added the usual telemetry configuration, with a different serviceName.
Finally, start the composer:
npm run start
Run the Test
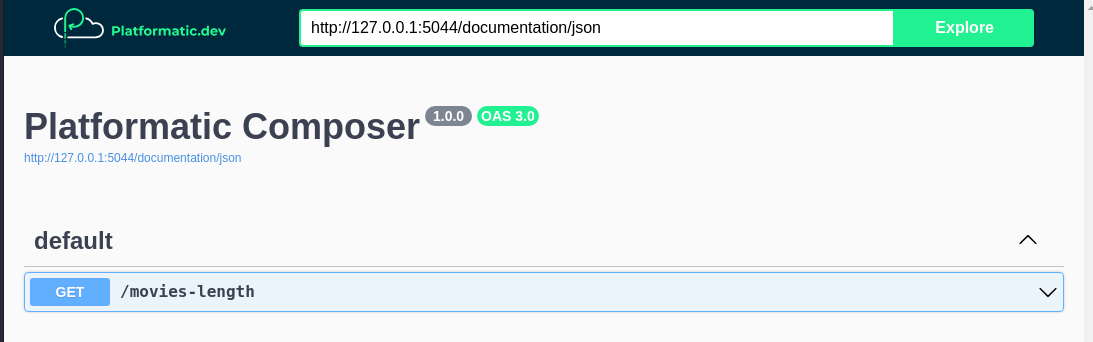
Check that the composer is exposing movies-length opening: http://127.0.0.1:5044/documentation/
You should see:
To add some data, we can POST directly to the DB service (port 5042):
curl -X POST -H "Content-Type: application/json" -d '{"title":"The Matrix"}' http://127.0.0.1:5042/movies
curl -X POST -H "Content-Type: application/json" -d '{"title":"The Matrix Reloaded"}'  http://127.0.0.1:5042/movies
Now, let's check that the composer (port 5044) is working:
curl http://127.0.0.1:5044/movies-length
If the composer is working correctly, you should see:
{"length":2}
However, the main interest of this example is to show how to use the Platformatic Telemetry, so let's check it. Open the Jaeger UI at http://localhost:16686/ and you should see something like this:
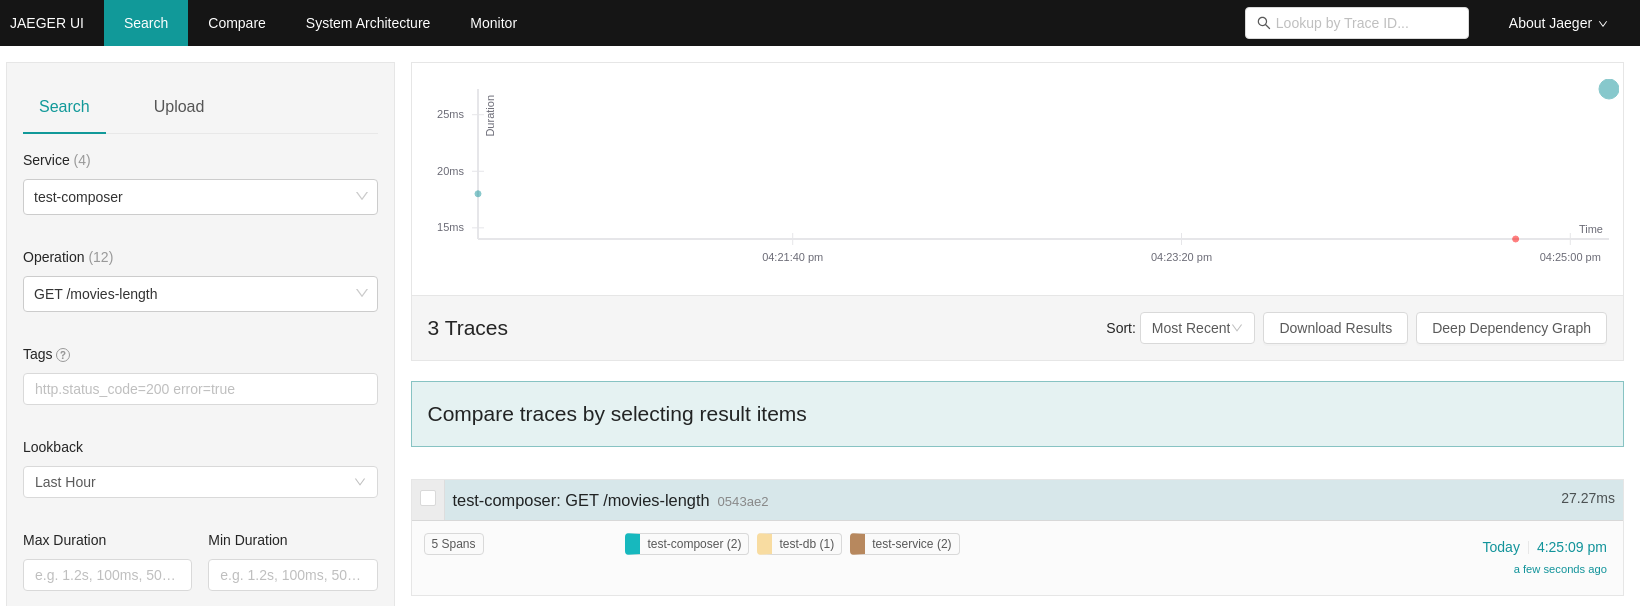
Select on the left the test-composer service and the GET /movies-length operation, click on "Find traces" and you should see something like this:
You can then click on the trace and see the details:
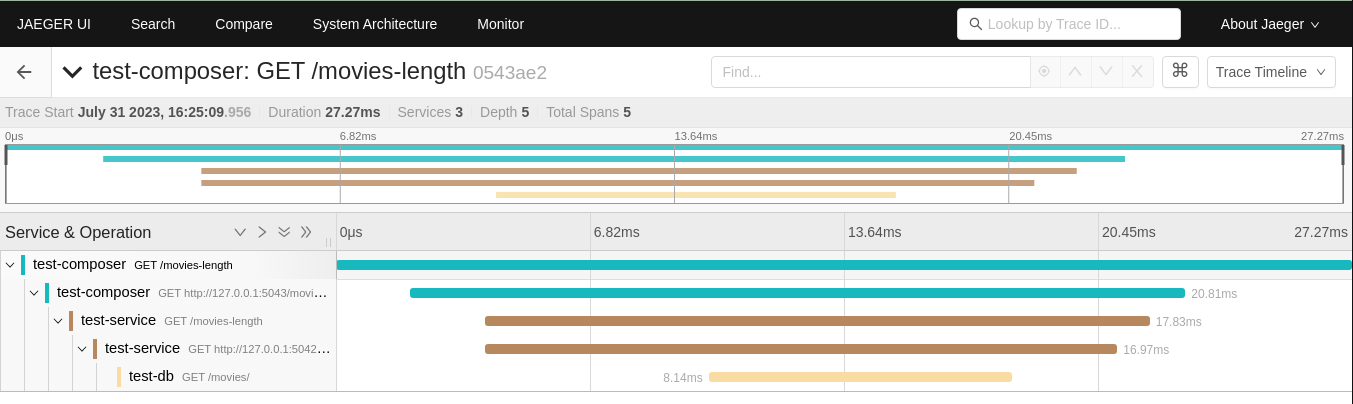
Note that every time a request is received or client call is done, a new span is started. So we have:
- One span for the request received by the
test-composer - One span for the client call to
test-service - One span for the request received by
test-service - One span for the client call to
test-db - One span for the request received by
test-db
All these spans are linked together, so you can see the whole trace.
What if you want to use Zipkin?
Starting from this example, it's also possible to run the same test using Zipkin. To do so, you need to start the Zipkin server:
docker run -d -p 9411:9411 openzipkin/zipkin
Then, you need to change the telemetry configuration in all the platformatic.*.json to the following (only the exporter object is different`)
  "telemetry": {
    (...)
    "exporter": {
      "type": "zipkin",
      "options": {
        "url": "http://127.0.0.1:9411/api/v2/spans"
      }
    }
  }
The zipkin ui is available at http://localhost:9411/